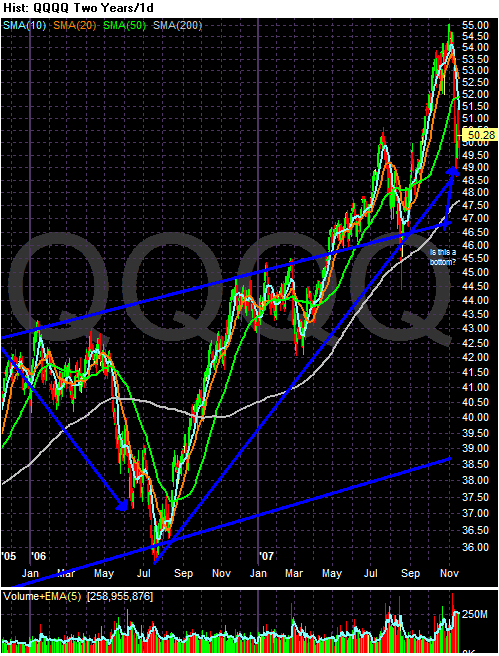
First, notice on the multi-year chart we're currency near a long-term trend line. Keep that in mind as we move through these charts.
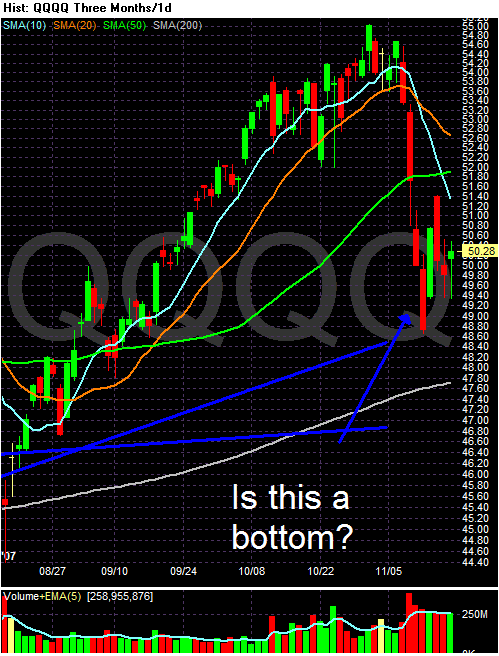
Are the QQQQs forming a bottom? That's the question we need to ask ourselves right now. The QQQQ's dropped hard at the end of last week, but have since been trying to find some kind of consolidation pattern. Remember the QQQQs were the market darling until a few weeks ago -- their lack of exposure to the mortgage mess was their saving grace. My guess is some traders are starting to nibble at cheaper shares based on the market's current position right above long-term support.
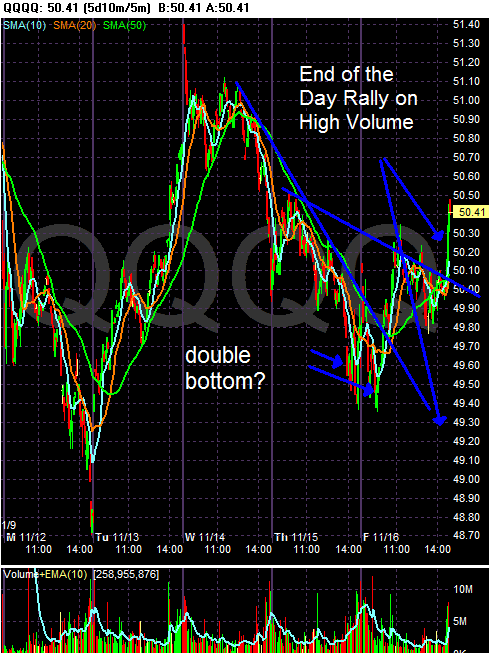
On the 5 day chart, notice the QQQQs dropped hard from Wednesday to the opening on Friday, but then formed a double bottom and rallied from there. Also notice the strong finish. We've gotten use to end-of-the-day sell-offs. Instead of that today we got a rally. This is a good sign because it indicates traders are willing to hold positions over the weekend -- a rather precarious proposition in the current economic environment.
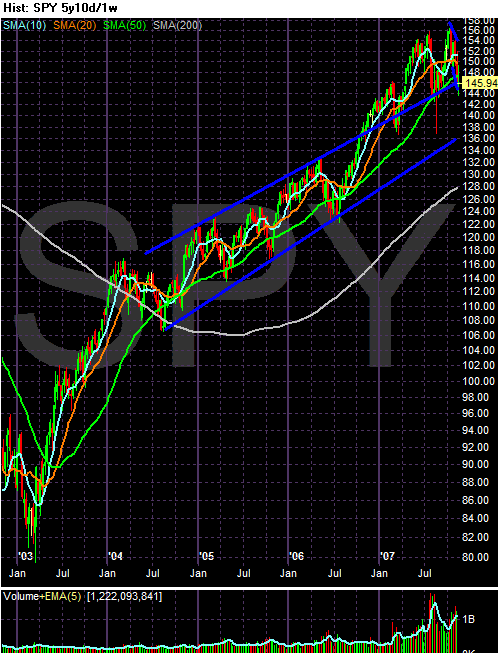
The SPYs are currently at the upper trend line of a three year upward sloping channel. That's a technically important position.
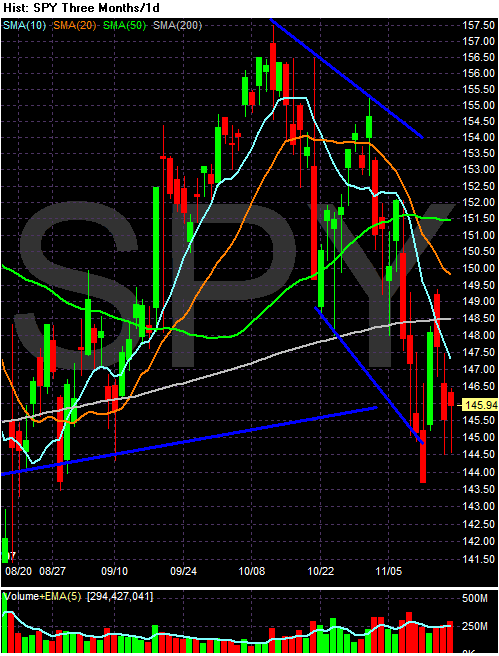
The SPYs daily chart indicates we are still looking for direction. The index is right below the 200 day SMA and the shorter SMAs are all pointing downward. But the upper trend line of the 3-year channel is acting as a center of gravity for prices right now.
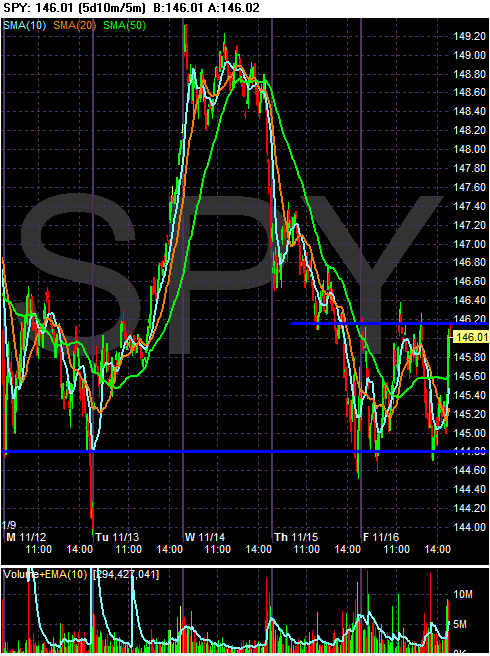
On the 5-day chart, notice we really didn't gain much ground this week. The index rallied, but couldn't hold the position. And while they too enjoyed an end-of the day rally, that rally didn't really push the index into technically meaningful territory; the index simply stayed in the day's overall range. All in all, a fair end but not great.