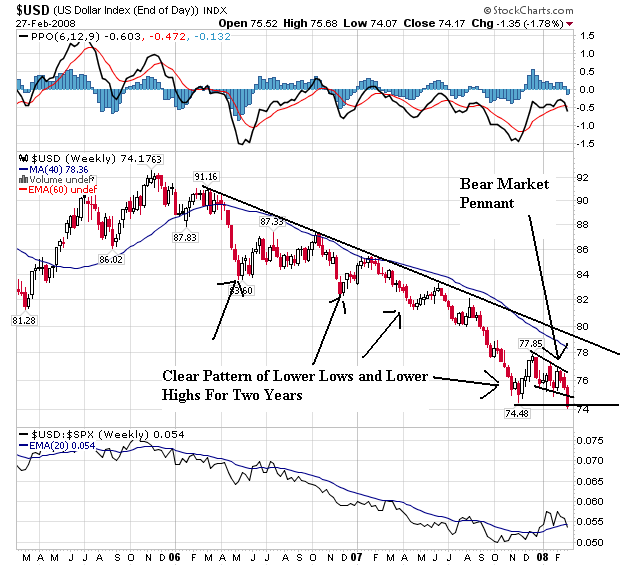
As the chart above clearly shows, the dollar has been dropping for the better part of the last two years. There are a lot of reasons for this. The mammoth US trade deficit (which is getting a bit better) and the large amount of US debt held by foreigners are prime reasons. However, since the Fed started cutting rates aggressively, the dollar has continued to drop.
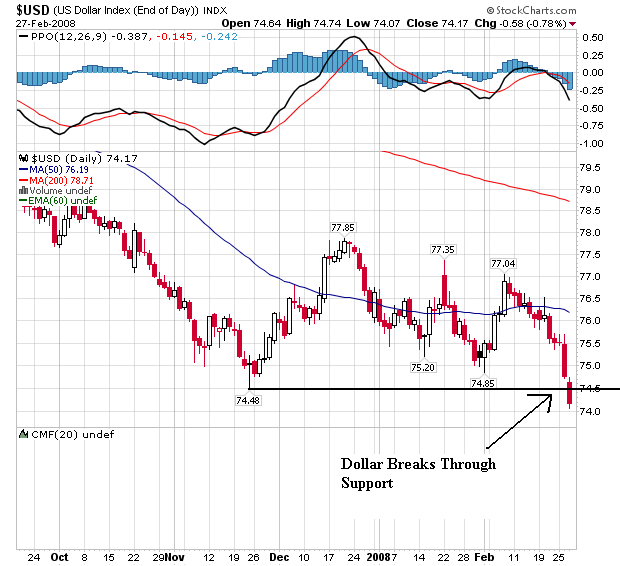
As the chart above shows, the dollar fell to a new low yesterday, after forming a bear market pennant from mid-December until recently. The reason? The promise of more interest rate cuts from the Fed:
The dollar traded at a record low below $1.51 per euro after Federal Reserve Chairman Ben S. Bernanke signaled he's ready to lower interest rates again to support the weakening U.S. economy.
An index that tracks the currency against six major counterparts dropped yesterday to the lowest since its inception in 1973, as European Central Bank policy maker Axel Weber said investors expecting rate cuts in the region are underestimating inflation. The U.S. currency fell to an all-time low against the Swiss franc and to a 23-year low versus the Australian dollar.
``This is a new chapter for the dollar,'' said Russell LaScala, head of foreign-exchange trading in North America at Deutsche Bank AG in New York. ``You are seeing divergence of central banks' views.''
.....
LaScala said dollar-selling gained momentum on Feb. 26 after Fed Vice Chairman Donald Kohn said turmoil in credit markets and the possibility of a slower economy pose a ``greater threat'' than inflation. The currency has slid 4 percent against the euro in the past three weeks as the housing recession worsened and consumer confidence sank, leading traders to exit bets on a dollar rebound. The dollar will rise to $1.45 per euro by mid-year, according to the median forecast in a Bloomberg survey.
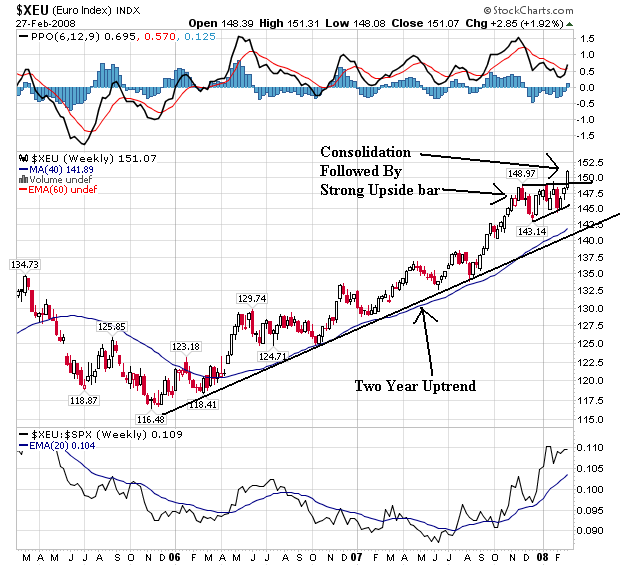
As the dollar has dropped, the euro has benefited. Notice how the euro and the dollar chart for the last two years are near mirror images of one another.
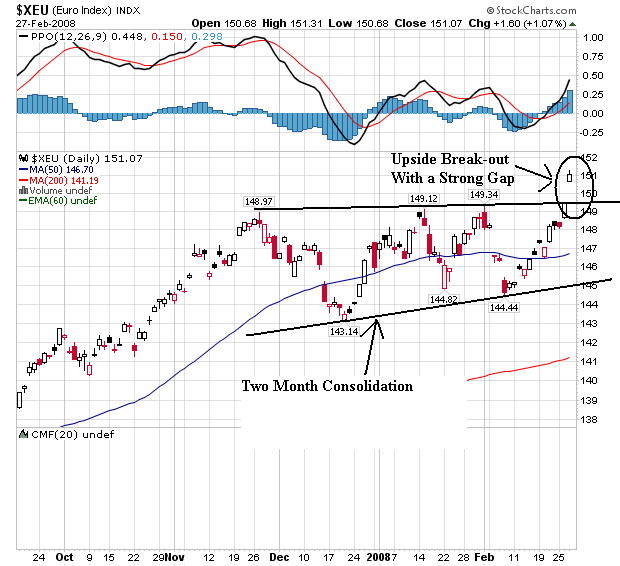
And notice how the euro dollar mirror image relationship plays out in the daily chart above.
Now let's add one more piece to the puzzle -- oil.
Crude-oil futures fell more than $1 to end below $100 a barrel on Wednesday, after hitting a record high above $102 overnight, as government data showed a bigger-than-expected buildup in U.S. crude inventories.
Crude oil for April delivery dropped $1.24, or 1.2%, to settle at $99.64 a barrel on the New York Mercantile Exchange. It surged to an all-time high of $102.08 in electronic trading over night, driven up by the weaker dollar.
Here is a long-term chart of oil:
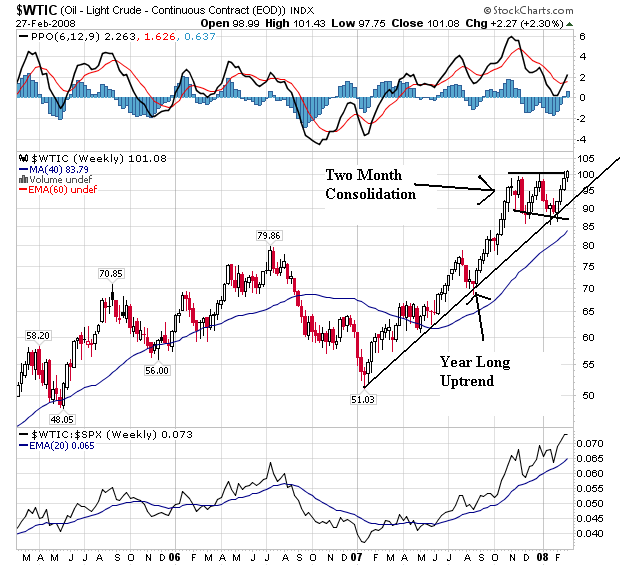
Notice the clear long-term rally in place for the last year.
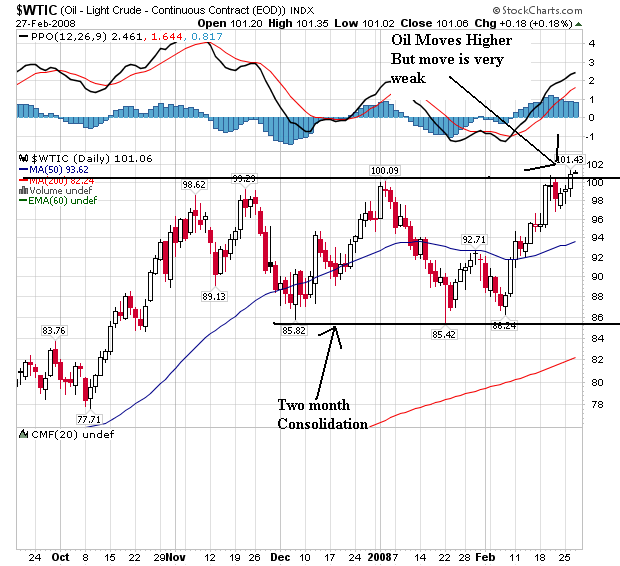
On the daily chart, notice the trading/consolidation range for the last few months and the recent break-out. However, also notice the break-out isn't that strong.
So -- let's look at the following chain of events.
1.) The Fed is lowering interest rates and has signaled they will continue to lower rates.
2.) This entices forex traders to sell the dollar.
3.) A dropping dollar encourages oil traders to buy oil as an inflation hedge from the dropping dollar.
4.) A dropping dollar is also a de facto decrease in the value of oil -- which it so happens is priced in dollars. This puts a price floor under oil's price.
5.) As oil prices increase, inflation increases.
6.) As the dollar drops, forex traders look to a stable currency which is the euro (at least for now).
So as the Fed lowers interest rates, they are in fact stoking energy inflation and encouraging the migration away from the dollar.