The Empire State index showed a big decline:
The Empire State Manufacturing Survey indicates that conditions for New York manufacturers deteriorated in February. The general business conditions index tumbled nearly 21 points to -11.7, falling below zero for the first time since May 2005. The new orders and shipments indexes also dropped into negative territory. The prices paid index rose for a second consecutive month, to its highest level in considerably more than a year, while the prices received index remained elevated but close to January’s level. Employment indexes dipped below zero. Future indexes were generally positive, but well below levels of late last year. In particular, future employment indexes posted significant declines, hovering just above zero.
Here's the accompanying chart
And yesterday's Philadelphia survey also dropped:
The survey’s broadest measure of manufacturing conditions, the diffusion index of current activity, fell from -20.9 in January to -24.0 this month (see Chart). Forty percent of the firms reported no change in activity from January, but the percentage of firms reporting decreases (42 percent) was substantially greater than the percentage reporting increases (18 percent). Other broad indicators also suggested continued declines this month. Demand for manufactured goods, as represented by the survey’s new orders index, remained negative, although the index increased from -15.2 to -10.9. The current shipments index, however, fell 10 points, from -2.3 to -12.2. Indexes for both unfilled orders and delivery times remained negative.
Here's the accompanying chart:
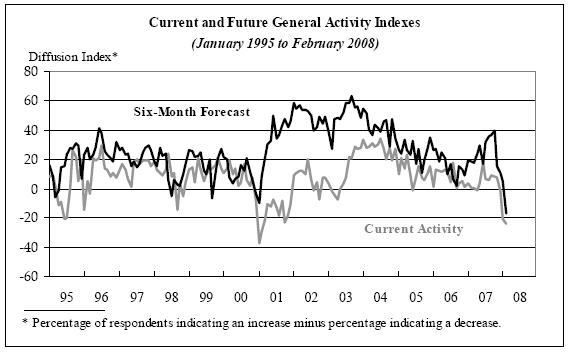
Notice the incredibly large drop-off over the last 6 months or so.
The Federal Reserve also issued industrial production recently.
Industrial production increased 0.1 percent in January for a second consecutive month. Output in the manufacturing sector was unchanged in January, as lower output of motor vehicles and parts offset a small net gain elsewhere. The output of utilities climbed 2.2 percent, while the output of mines moved down 1.8 percent. At 114.2 percent of its 2002 average, overall industrial production was 2.3 percent above its January 2007 level. The rate of capacity utilization in January was unchanged, at 81.5 percent, a rate 0.4 percentage point above its year-earlier level and 0.5 percentage point above its 1972-2007 average.
However, the details tell a clearer story:
Consumer energy products advanced, consumer non-energy nondurables remained unchanged, and consumer durables fell.
In other words, the increase in consumer products is pretty much about energy and not companies responding to increased consumer spending.
The output of business equipment rose 0.4 percent in January; increases in information processing equipment and in transit equipment outweighed a decrease in industrial and other equipment.
So tech output increased (which is good) but everything else didn't.
The output of construction supplies fell 1.1 percent in January after a rise of the same magnitude in December; production in January was 1.2 percent below its year-earlier level and about 4 percent below its peak in 2006. The output of business supplies increased 0.5 percent.
The production of non-energy materials edged down 0.1 percent in January, while the output of energy materials was unchanged.
So, construction got an end of the year bump, but then decreased.
The bottom line is the information from the manufacturing sector isn't that good. Consumer energy goods are increasing production, but other consumer areas are trading water. On the industrial side, construction related areas dropped while information tech increased. This is a very lop-sided picture. Let's see how this has effected the XLIs -- the industrial ETF.
The 5-year chart in weekly increments shows a clear uptrend in place. While the index briefly dropped below the trend line at the beginning of this year, the lack of follow though (or the quick turnaround) implies traders still see a great deal of value in this sector.
Above is a 1 year weekly increment chart. It shows a pretty clear triangle patter that formed in the second half of last year. A triangle pattern is considered topping or reversal pattern.
Above is a three month chart in daily increments with the simple moving averages visible. Notice the following:
-- Prices are below the 200 day SMA.
-- The 200 day SMA is pretty much level and the 10 and 20 day SMAs are rising
-- Only the 50 day SMA is moving lower.
-- The 10, 20 and 50 day SMAs are bunched together, indicating a lack of direction, or a market looking for direction.
In other words, the industrial sector is concerned about the information, but traders aren't willing to give up the ghost. My guess is there is still a lot of confidence in international growth at this point.