Plosser's Speech
By last September, we had already seen a cumulative deterioration in the housing sector during the earlier part of 2007. In addition, the disruptions in financial markets in August caused by the problems in the subprime mortgage market raised the risk of potential adverse effects on the broader economy from a further tightening of credit conditions. As a result, I lowered my projection of economic growth for the fourth quarter of 2007 and the first half of 2008. In particular, the adjustment to my forecast involved pushing back the turnaround in residential construction, as low demand for homes meant it would take longer than expected for the economy to work off the inventories of new and existing homes for sale. The continuing high prices of oil and other commodities also suggested the potential for some slowing in the pace of economic activity, as well as hinting at increasing inflationary pressures — a point I will return to later. As the outlook changed, the FOMC lowered the fed funds rate target by 50 basis points in September, and then by another 25 basis points in both October and early December.
Since the Committee’s meeting in early December, the economic data have indicated that the deterioration in the housing market has continued unabated. Although that by itself was discouraging, other economic indicators also showed signs of an economy that was weakening. The renewed widening of some credit spreads in financial markets, along with weaker figures for retail sales, manufacturing activity, and job growth in December, led many forecasters in early January to further mark down their forecasts for 2008. The sharp rise in December’s unemployment rate, which was released in early January, also heightened many economists’ concerns about the economy’s health. What’s more, the Philadelphia Reserve Bank’s closely watched manufacturing survey recorded a surprisingly steep decline in industrial activity in January, to a level not seen since the last recession.
Let's take this information one piece at a time.
By last September, we had already seen a cumulative deterioration in the housing sector during the earlier part of 2007.
The housing market has been falling apart for some time. First, the problem was "contained", then the problem was only a "small section of the economy". Now economists are realizing how important housing was to the last expansion.
Here is a chart of total existing homes for sale:
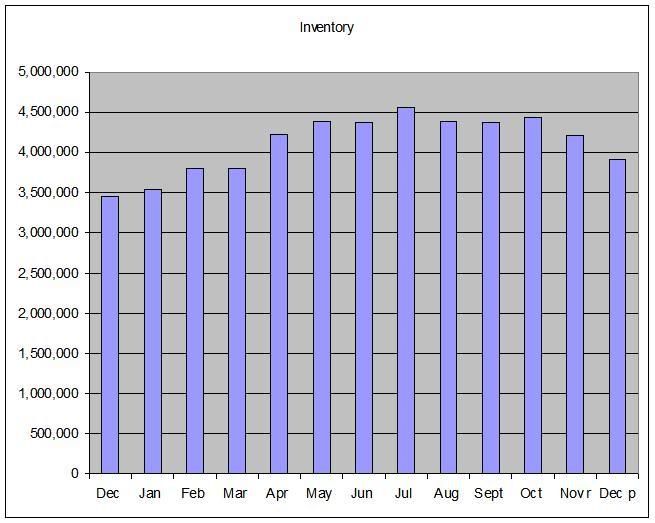
While the total inventory dropped last month, December is typically a month when people pull their homes off the market. Also note we're just shy of 4 million homes on the market, which is a ton of home.
Here is a chart of the months of supply at the current sales pace:
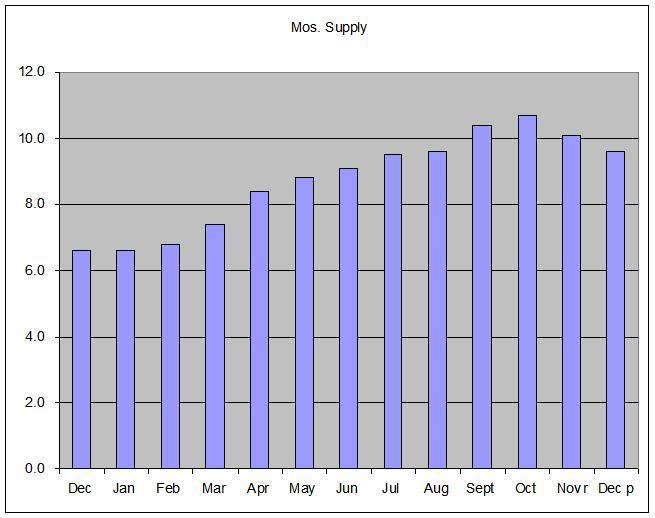
Again this number dropped last month, but December is not the hottest month for real estate. If we continue to see a drop over the next few months then we'll be in better shape. In addition, with the credit market tightening a strong rebound seems unlikely.
The continuing high prices of oil and other commodities also suggested the potential for some slowing in the pace of economic activity, as well as hinting at increasing inflationary pressures — a point I will return to later.
The Fed is in a classic pickle right now. On one had they are looking at the possibility of a recession. On the other hand, commodity prices aren't looking like they want to come down anytime soon.
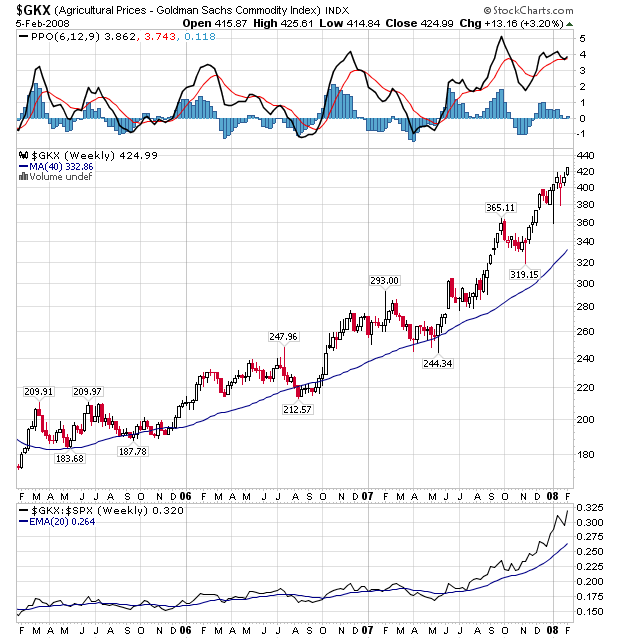
Here is a chart of agricultural prices:
And here is a chart of oil prices
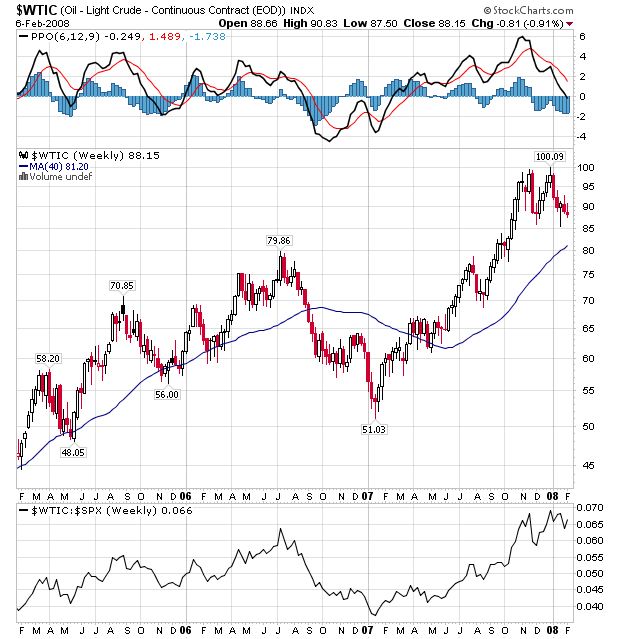
While the agricultural price chart is in a clear multi-year bull market, oil may be topping right now. We could be looking at a double top forming in late 2007 and early 2008. However -- we'll have to wait an see how that plays out. On the bearish side, a slowing economy does mean less oil demand from the US. But on the bullish side there is India and China and their increased demand for oil caused by their respective growth levels. In other words, barring a major change in the demand side of the equation, I wouldn't expect oil to see a major price drop.
The renewed widening of some credit spreads in financial markets, along with weaker figures for retail sales, manufacturing activity, and job growth in December, led many forecasters in early January to further mark down their forecasts for 2008.
For a discussion of the tightening credit markets, see this article
Here is a chart of total retail sales from the St. Louis Fed:
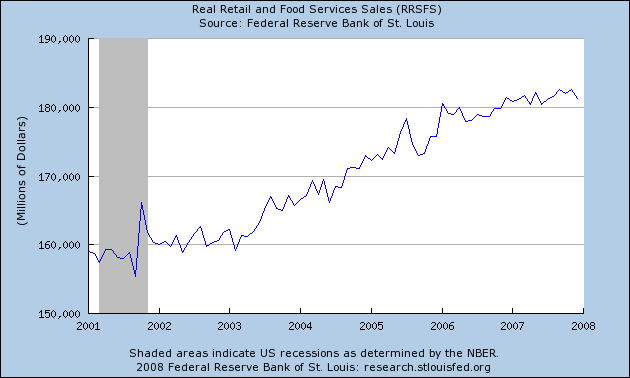
Notice that while sales are still increasing, we've seen somewhat of a leveling off over all of 2007.
Here is a chart of the year-over-year percentage change
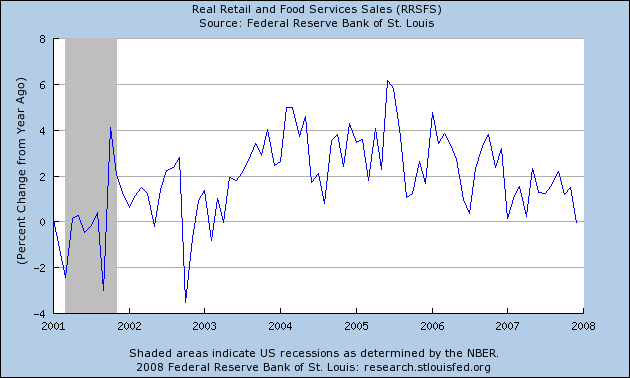
Notice that 2007 results were considerable weaker than 2006 and 2005. While sales spent more of the year around the 1.8% level, they dropped near the end of the year when there should have been a nice holiday push.
Here is a chart from Martin Capital Advisers of manufacturing data:
Note that the overall change in industrial production has been about 2% over 2007. That's a decent reading, but is clearly off its highs. Also note that ISM manufacturing index has been dropping since about mid-2007, indicating manufacturing is weakening.
Here is a graph from the WSJ:
I've blocked off 2007 and added a darker line to the 100,000 level for job creation. Notice the following.
-- There were only 5 times in 2007 that monthly payroll growth exceeded 100,000.
-- One of those times was a "just barely" number
-- Four of those times occurred in the first half of the year.
-- For five months, job growth came in at 50,000 - 100,000.
-- Two times after a big number, the following month's number was really low (as in barely positive). Two other times, the number came in between 50,000 - 100,000.
In short, the last year's employment numbers have been terrible.