Supply fears sparked a rally in Minneapolis Grain Exchange wheat futures, with the nearby contract climbing nearly 25% on the day.
MGE March wheat surged to a record $25 a bushel before closing up $4.75, at $24 a bushel. Most-active May MGE wheat rose by the exchange-imposed daily limit of 90 cents, at $17.0825 a bushel.
.....
Tight supplies of high-protein hard red spring wheat, which is used to make bread and traded at the MGE, have underpinned the market this year. The current rally stems from mid-January, after the Agriculture Department said seedings of fall-planted winter wheat didn't expand as much as expected, despite strong prices.
Since the end of last year, March wheat is up about 132%. Demand remains strong for high-quality grain and cash prices are strong, traders said.
First -- notice that high prices didn't entice a rash of new plantings. That means supplies will be tight this year adding further upward pressure to prices.
Now, let's look at the charts.
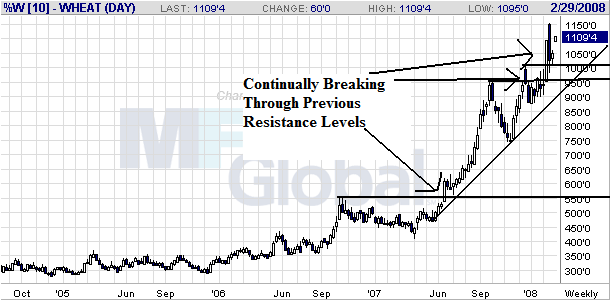
The long-term chart shows the market is in the middle of a long-term rally. Prices have made a series of higher highs and higher lows and have continually broken through previous levels of resistance.
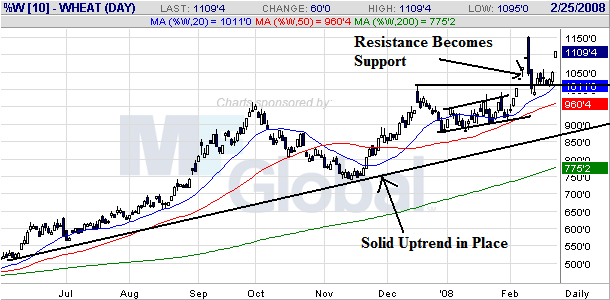
On the daily chart, notice:
-- Prices are above the 200 day SMA
-- There is a clear uptrend in place
-- All the SMAs are headed higher
-- The shorter SMAs are above the longer SMAs.
-- Prices consolidated at the beginning of 2008, after which time they broke through resistance which then became support.
This is a bullish chart.