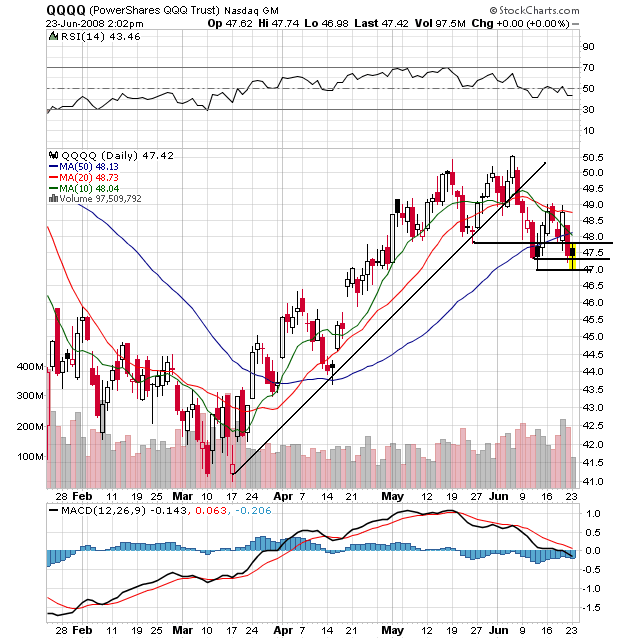
On the QQQQs, notice the following:
-- Prices broke an uptrend in early June.
-- Prices are below all the SMAs
-- The 10 and 20 day SMA are headed lower
-- The 10 day SMA broke through the 200 and 50 day SMA
This chart is neutral right now, although it is becoming more and more bearish.
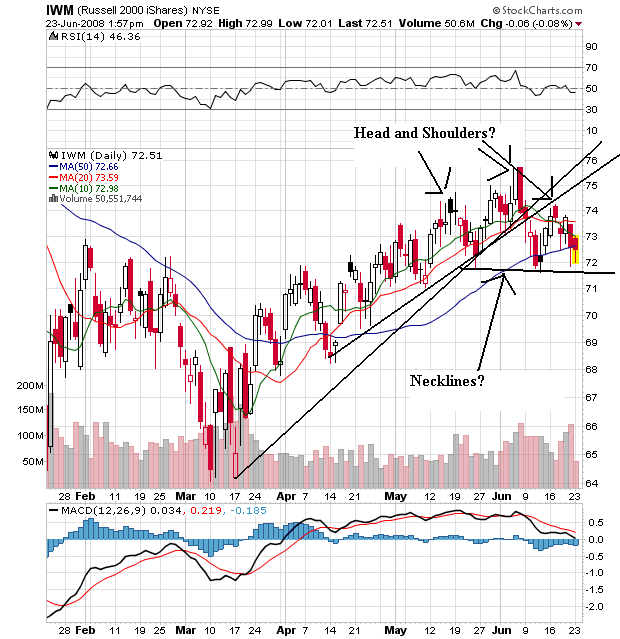
On the IWMs, notice the following:
-- Prices are below all the SMAs
-- The shorter SMAs never broke through the 200 day SMA
-- The 10 day SMA is headed lower and is about to cross through the 50 day SMA
-- Prices punched through the 200 day SMA, but couldn't keep their upward momentum going.
-- Also note the possible head and shoulders formation.
-- Like the QQQQs, this is a neutral chart, but it's getting more and more bearish.