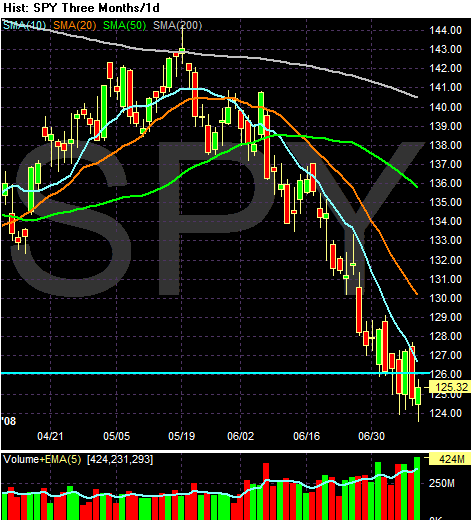
First, notice the following:
-- Prices are below the 200 day SMA
-- Prices are below all the SMAS
-- All the SMAs are moving lower
-- The shorter SMAs are below the longers SMAs
In other words, the price and SMA alignment is about as bearish as you can get.

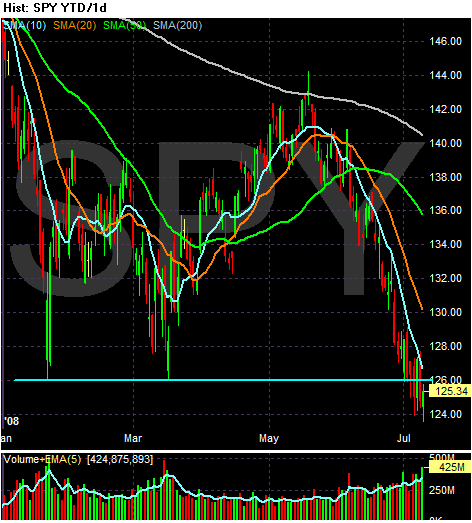
Above is a 6 month chart. Notice that prices are right below the lows set earlier this year. These two lows were part of a double bottom formation from which the market rallied.

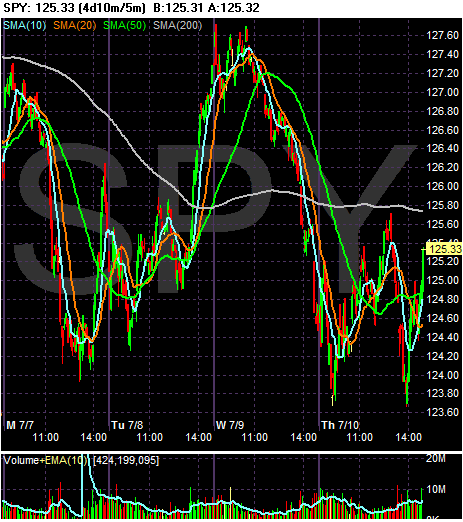
Above is this week's chart in 5 minute increments. Notice a few important points.
-- Prices are meandering between two points. That means prices are consolidating.
-- There is a double bottom formation, with the first bottom forming late Monday and the second bottom forming today.
-- There is a second double bottom formation, with both bottoms occurring during today's trading.
Earlier this week, Barry over at The Big Picture noted that after a bad month a rebound was possible. The 5-minute chart says a bottom is forming. The question now is where is the rebound.