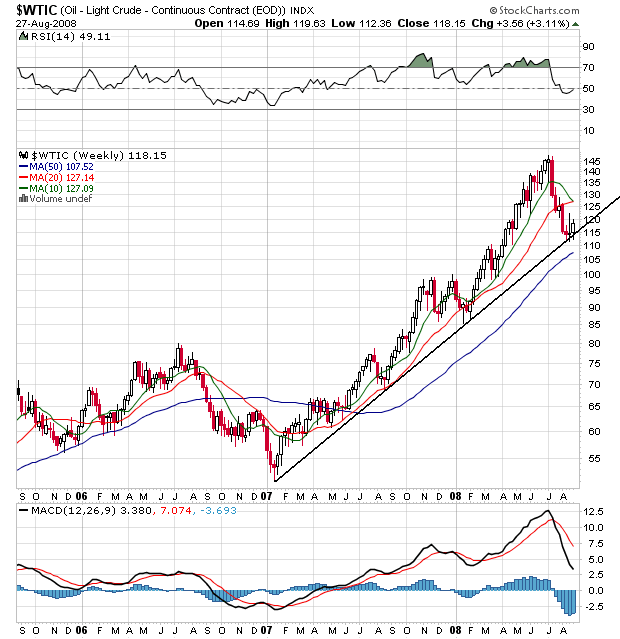
On the long-term chart, notice the following:
-- Prices are resting on the long-term trend line. That means despite everybody being thrilled about lower oil prices, the uptrend that started a little over a year ago is still in place and can be resumed at any time.
-- The 10 week SMA is about to move through the 20 week SMA. Because this is a weekly SMA it takes longer to move. However, that makes a move that much more significant.
-- Prices are below the 10 and 20 week SMAs, which will keep these SMAs under downward pressure.
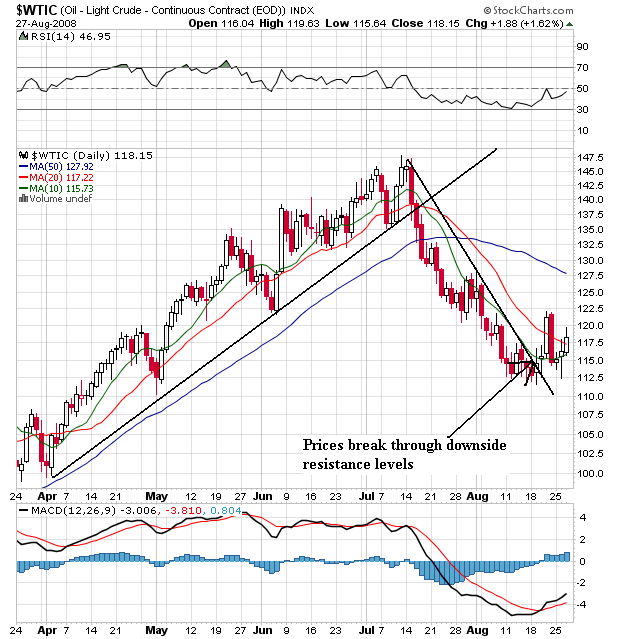
On the daily chart, notice the following:
-- Prices have broken through the downward sloping trend line established at the beginning of the correction, indicating a trend reversal.
-- The 10 day SMA is turning the corner and will cross over the 20 day SMA
-- Prices are trying to move above the 10 and 20 week SMA, although they are not there yet.