With the exception of personal income (stagnant) and construction spending (still tanking), all of the monthly data this week was neutral to excellent.
The economy added 162,000 jobs in March, only 48,000 of which were census jobs, a kick-a** good number. Hours worked were up, the employment participation rate was up, and January and February were revised up.
Unemployment stayed the same at 9.7%, which is unacceptably high, of course, but nevertheless a decent result with the workforce adding 298,000 new persons.
March Auto sales were less than 12 million annualized, but still the highest in 7 months.
Chicago PMI was good, and the ISM manufacturing report was kick-a** stellar, showing increasingly strong positive activity in almost all sub-indices.
Turning to the high frequency weekly numbers ...
The ICSC reported that seasonally adjusted weekly same store sales we up 3.2% YoY (an easy comparison) and up 0.6% from the previous week. ShopperTrak reported that "year-over-year GAFO retail sales increased a 2.7 percent for the week ending March 27 while sales slipped 1.0 percent versus the previous week ending March 20." Retailers are apparently telling analysts that their March sales are kicking a**.
The E.I.A. reported that gasoline cost $2.80 a gallon. Oil was near $85/barrel late in the week. This is going to be a major concern later in this year. Usage was lower YoY as reported in the chart, but higher in the graph immediately below at their site. I have no idea why.
The BLS reported that new jobless claims were only $439,000, the lowest in about 18 months. The 4 week graph shows that the downward trend is established again.
Railfax again showed another strong week. All 4 components of transportation were up strongly, and 3 were also up strongly vs. last year. Rather than me try to describe, click on over and look at the graphs yourself. Rail traffic is also kicking a** YoY.
Daily Treasury Statement shows that March withholding taxes totaled $164.9B. That isn't just about $9B above March 2009 (about 5%), it is also several $billion higher than March 2008! Angry Bear has updated their graph of daily withholding taxes measured YoY, and here it is:
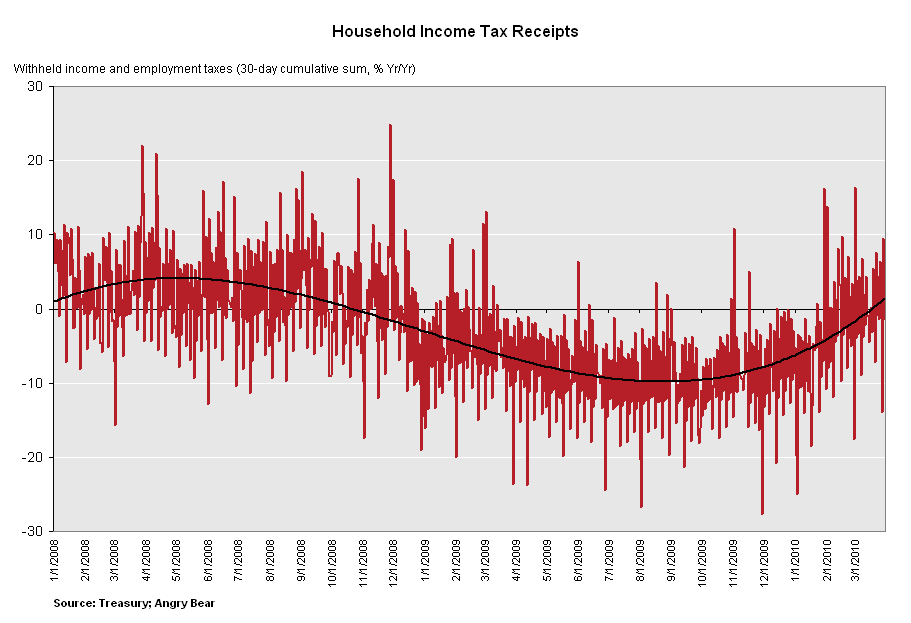
Another kick-a** report.
Everybody have a great weekend, hopefully the weather will be beautiful where you are. Maybe we can even get Bonddad to post some doggies....