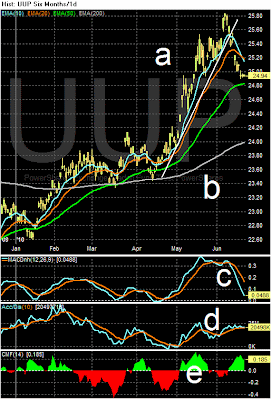
Let's start with a look at the dollar.

The last 10 days have seen the dollar in a clear downtrend (a) with small, counter-trend rallies (b). For most of last week, the dollar would consolidate in narrow trading ranges for most of the trading days (c).

On the daily chart, note that prices broke a major trend line (a) and the shorter EMA are giving sell signals with the 10 and 20 day EMA moving lower and the 10 moving through the 20 day EMA (b). The MACD has given a sell signal as well (c). But we're seeing a net inflow into the security during part of the sell off (d and e) -- a very curious development.
One of the primary effects of the dollar's drop is an increase in some commodity prices.

Agricultural prices are in a clear uptrend (a), although they spent the last two days of last week in a sideways consolidation pattern (b).
Not all commodities have engaged in strong rallies, however.

While industrial metals have broken though key resistance (a), prices are again falling and will probably test the downward sloping trend line. Also note the shorter EMAs have returned to a very bearish orientation (b). While the MACD has given a buy signal (c), the A/D and CMF have not followed suit (d and e), indicating there is not a huge move into this area of the market yet.
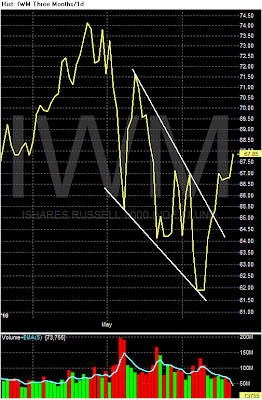
When looking at the equity markets, consider the following four charts:


While there has been a tremendous amount of volatility, the reality is the markets were in downward sloping channels which they have all broken out of.


And finally, will the Treasury market continue higher or break trend (a)?