
Let's start (again) with the Treasury market. Yesterday, the IEFs bounced off the 50 day EMA in a technical rebound, but did so on weaker volume. Also note the 10 day EMA crossed below the 20 day EMA.

Yesterday the IWMS were the real start, moving 2.48%. This indicates that risk capital was moving into the market. Prices gapped higher at the open (a), consolidated (b) and then moved higher in two more moves (c and d). Prices then consolidated for the late morning and early afternoon before making one last move higher (f) on increasing volume (g). Prices closed near their daily highs, indicating traders were willing to hold positions overnight -- a bullish sign.

The dollar is currently consolidating in a downward sloping pennant pattern (a).

But note the EMA picture is fairly bearish -- prices are below the 200 day EMA, all the shorter EMAs are moving lower and the shorter EMAs are below the longer EMAs (a). On the positive side, prices are gravitating around the 200 day EMA, indicating the market is still trying to make a bullish or bearish move.
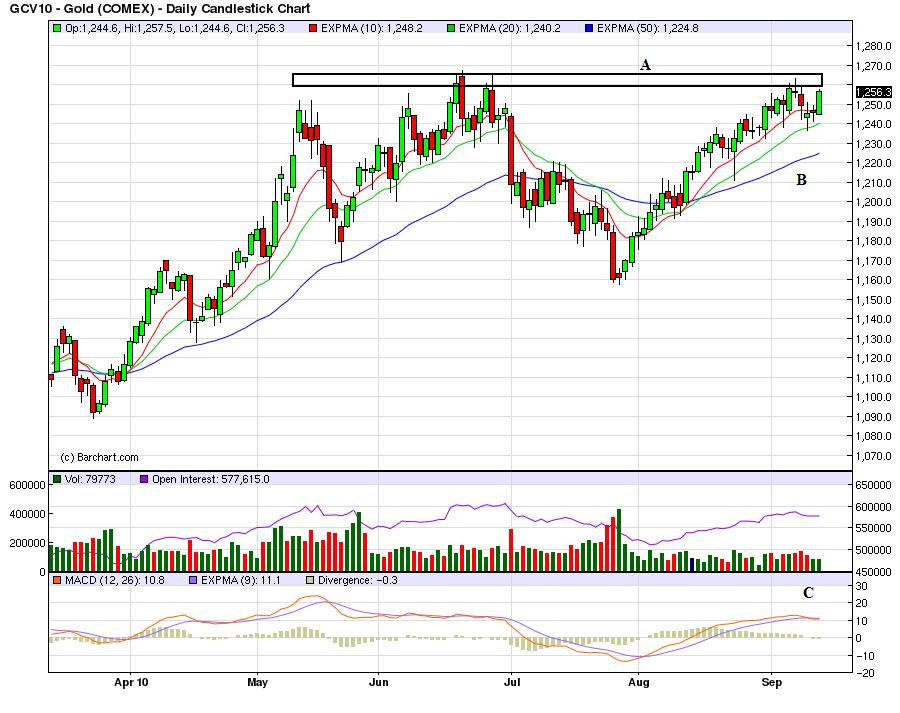 Gold is again hitting resistance in the (A) area. However, the EMAs are still bullish, but momentum is starting to stall (C).
Copper is still in an uptrend as denoted by the EMAs (A). Prices have consolidated several times in downward sloping pennant patterns (B and C). Momentum is weak (D).