As promised, I want to take a closer look at the latest unemployment statistics. The February jobs report showed a decline in the unemployment rate of almost 1% in the last three months. More specifically, the unemployment rate for African Americans has declined from 16.0% to 15.3%; and for Latinos from 13.2% to 11.6%. Is the news for minorities as improving as the numbers make it look, or is there something else going on? Put another way, is the decline in the unemployment rate "real" or it it people becoming discouraged and dropping out of the labor force?
The BLS starts with the working age population. People in that set are either in the labor force, or not in it. Of the subset of people in the labor force, there are further subsets of employed or unemployed. So if people drop out of the labor force (as defined by the BLS), they are no longer counted as unemployed. But that distorts the unemployment rate, making the employment situation look better than it really is.
To test how much of the drop in the unemployment rate was "real" vs. "discouraged workers" who dropped out of the labor force, I crunched some numbers to get a "real" unemployment rate. First, I held the "not in the labor force" ratio constant from November to February , exactly as it would be If there were no increase in discouraged workers in the last three months. Since the BLS helpfully produces a statistic called the "employment-population ratio", then all I have to do is create an "unemployed-population ratio" that is the mirror image of that change. Next I take the 3 month change in that "unemployed-population ratio" and solve for the equivalent change in the "official" unemployment rate, creating a "real" rate. The difference between the "real" unemployment rate vs. the actual unemployment rate shows how much of the decline is persons dropping out of the labor force.
Thus, for example, if in November 60% of the working age population were employed, 10% unemployed, and 30% not in the labor force, then in February if 61% were employed, by holding the labor force constant as a percentage of the working age population, 9% would be unemployed. The change in the unemployment-population ratio is 10:9. If the unemployment rate in November were 6%, holding the labor force constant gives us a predicted unemployment rate of 5.4%. (10:9 = 6:5.4). The extent to which the actual February unemployment rate is different from 5.4% tells us how much of the change in the unemployment rate is "real" vs. persons dropping out of (or entering) the labor force.
I performed this exercise for the population as a whole, and also by race (white, black, Latino), and also by level of education. The results were in stark contrast.
First, here is the total result and results broken down by race:
| Race or ethnicity | Nov. 2010 unrate | Feb. 2011 unrate | Nov. 2010 un-pop ratio (emply-pop) | Feb. 2011 un-pop ratio (emply-pop) | Feb. 2011 "real" un- pop ratio | Feb. 2011 "real" unrate |
|---|---|---|---|---|---|---|
| Total | 9.8 | 8.9 | 6.3 (58.2) | 5.7 (58.4) | 6.1 | 9.5 |
| whites | 8.9 | 8.0 | 5.8 (59.0) | 5.1 (59.4) | 5.4 | 8.3 |
| blacks | 16.0 | 15.3 | 10.0 (52.5) | 9.5 (52.2) | 9.7 | 15.5 |
| latinos | 13.2 | 11.6 | 8.8 (58.4) | 7.6 (58.4) | 8.8 | 13.2 |
Now here are the results by education level:
| Education level | Nov. 2010 unrate | Feb. 2011 unrate | Nov. 2010 un-pop ratio (emply-pop) | Feb. 2011 un-pop ratio (emply-pop) | Feb. 2011 "real" un- pop ratio | Feb. 2011 "real" unrate |
|---|---|---|---|---|---|---|
| H.S. dropout | 15.7 | 13.9 | 7.3 (39.3) | 6.3 (39.2) | 7.4 | 15.9 |
| H.S. graduate | 10.0 | 9.5 | 6.1 (55.0) | 5.7 (54.6) | 6.5 | 10.7 |
| some college | 8.7 | 7.6 | 6.0 (63.8) | 5.4 (64.1) | 5.7 | 8.3 |
| college diploma | 5.1 | 4.3 | 4.0 (72.7) | 3.3 (73.6) | 3.1 | 4.0 |
(N.B.:In the above graphs, "unrate" means "unemployment rate". "emply-pop" is the employment to population ratio - in parentheses. "Un-pop" is the unemployment to population ratio, actual for November, and adjusted for February with the labor force held constant. The two bolded columns are the "official" vs. "real" unemployment rates).
First of all, as to the population as a whole, only 1/3rd of the decline in the unemployment rate - 0.3% of 0.9% official decline - is due to actual employment gains. The other 2/3rd's is due to people dropping out of the labor force.
But two things really stand out:
1. the decline in the unemployment rate among college graduates is very real, in fact it is understating the change, because college grads are re-entering the workforce. By contrast, we can see that the lower one goes on the education scale, the less the "real" decline in unemployment, to the point where the "real" unemployment rate among those who only have a high school diploma or less, has actually increased in the last three months. This means that highly educated workers are returning to the workforce, but low-skilled workers are dropping out - and this during the best five month period for employment gains in the last three years.
2. something is going on with Latinos. Broken down by race/ethnicity, fully 2/3rd's of the decline in unemployment among both whites and blacks is "real." By contrast, there has been NO decline whatsoever in the "real" unemployment rate among Latinos.
By my figuring, if their participation rate had remained the same, there would have been 545,000 more unemployed Latinos than counted -- compared with 578,000 whites and 232,000 blacks. Considering Lationos make up only about 13% of the population, that is a HUGE dispartiy. And that is on top of the annual January population readjustment of -187,000 Latinos, vs. -233,000 whites -- and an upward adjustment of blacks -- which again is a huge disparity.
So why are Latinos dropping out of the population, and the workforce in such disproportionate numbers? I suspect the answer has to do with both voluntary and coercive emigration. Either a significant number of undocumented or marginally documented are returning to their home countries because of poor economic conditions here, or involuntarily due to fear of stepped up immigration enforcement or actual deportation.
The biggest categories of people who have dropped out of the labor force in the last three months are people with high school degrees but no college. This accords with the fact that the sectors hardest hit over the last few years have been construction and manufacturing. Both of those sectors employ blue collar physical laborers frequently with only a high school diploma or less. These are the people whose jobs are being replaced either in Asia or by robots, or nonexistent due to the 5 year old construction bust.
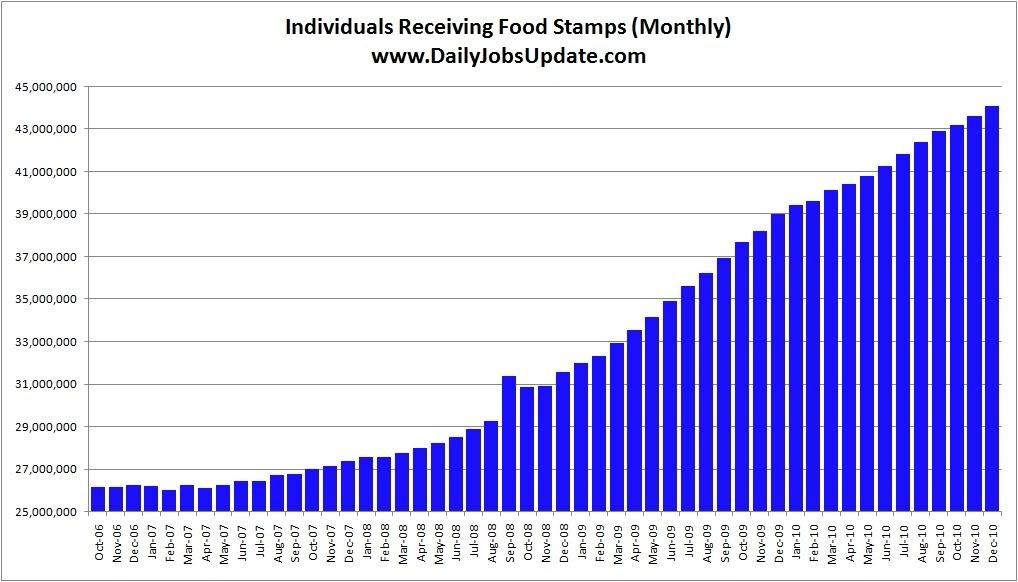
This also explains two puzzling and maddening facts about our society: as this graph courtesy of Matt Trivisonno shows, every month more and more Americans are going on food stamps:
Meanwhile, as this column among others points out, the Village of Washington, D.C. is full of college graduates who can't understand what the fuss is all about, and have moved on to "shared sacrifice" by the little people in the hinterlands.