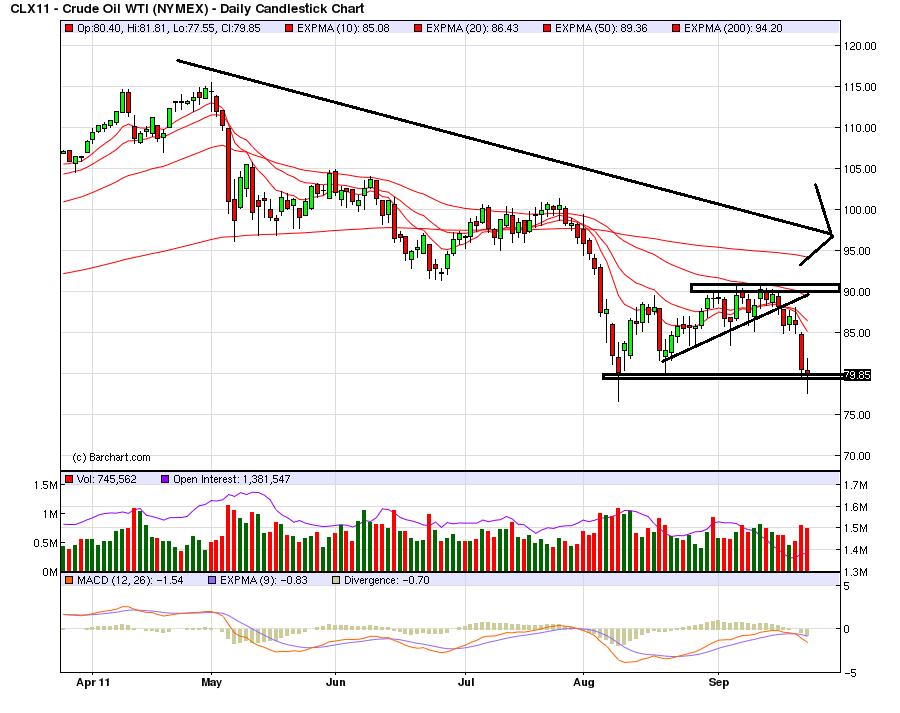
The oil market is in a clear downtrend, with resistance at 90 and support at 80. The MACD has given a sell signal and the EMAs are bearishly aligned. Prices have broken a short upward sloping trendline over the last week, and printed a very negative downward bar on Thursday. If prices break support at the 80 level, there is ample downside room on the chart.

The 5-minute chart shows the complete and total breakdown last week, when prices strongly moved through the 85 price level. The chart also shows there is a fair amount of technical support at the 80 area.

Gold fell out of bed last week. Prices moved through support a bit above 172, gapped lower an consolidated between 168 and 179 and then gapped lower again and moved lower for most of Friday, ending the week near the daily lows.

The daily chart shows extreme negative action. Prices gapped down sharply, printing two large gaps on increasing volume. Prices -- which had run into resistance at the 10 and 20 day EMAs have now moved through the 50 day EMA on a strong downward bar. This is a big sell-off in progress, with prices looking to find ultimate support at the 200 day EMA.

First, remember that the 114 area is a fib area.

112 is also an area of support established over the last few months. The market once again tested it and it -- once again -- held (at least so far). The short term EMAs (the 10 and 20 day EMAs) are still vacillating around neutral, not giving a strong indication in either direction. However, the longer term EMAs (the 50 and 200) are in clear downtrends. Plus, price is below these technically important EMAs.
The overall tone of the equity markets is still very negative.