
The 30 minute chart of the SPYs really highlights last week's price action. Prices rallied on Monday, but spent the last four days of the week consolidating, eventually trading between the 50% and 38% Fib levels on Thursday and Friday. This chart has strong support at the 138 and 139 areas, with resistance in the 141/141.25 area.
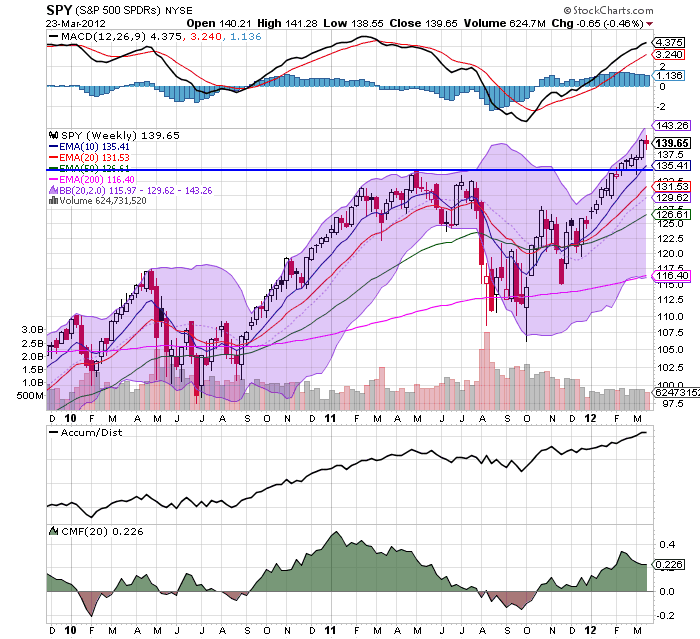
The weekly price charts gives us a good idea for the overall trend of the market right now. Prices are still in an uptrend after breaking through resistance at the 135 level. The EMAs are bullishly aligned (shorter above longer, all moving higher) and the secondary technicals (MACD, A/D and CMF) are signaling a continued move higher. The logical price target for a pullback (which we have to keep in mind given the underlying fundamental situation) is the 135 price level, which is only about 3% below current price levels.

The treasury market has rebounded from its recent sell-off. Reactions such as this are typical of a rapid movement in a particular direction, as traders think the market is either overbought or oversold. Prices here have several areas of natural upside resistance: the Fibonacci levels and the EMAs. The decreasing volume over the last few days indicates we're probably nearing the end of the rebound.

The 30 minute IEF chart shows two important points, the first of which is the price rebound from last week. Notice that after gapping higher at the open, prices didn't follow-through during the day. This shows the overall weakness of the counter-rally, as traders did not keep the momentum going throughout the trading day. In addition, the entire pattern that started on March 14 could be interpreted as a rounding bottom formation, which is a bottoming formation.
So, basically last week we see a counter-reaction to the bond market sell-off and equity market rally. As always, this leads to the following question: is this simply a shorter time frame, counter move, or is it the end of the counter-move and the start of a new trend?
Obviously, it's too early to give a definitive answer. However, last week's counter-reaction was the result of fundamental developments -- a slowdown in the EU, slower growth in China and weaker home sales in the US. In addition -- as I'll show tomorrow -- the weekly charts for the developing markets are all showing a sell-off, indicating further weakness. Like most situations, the real answer is, "let's see what the data says this week."